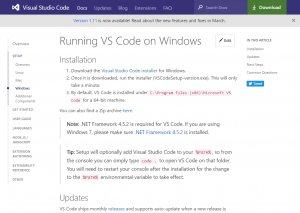
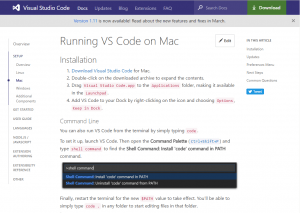
To use the ‘Open with Visual Studio Code’ function in the Umajin Editor main menu, you will first need to install Visual Studio Code onto your desktop device. To do this follow the instructions at the following link for your device.
Note: for Mac operating systems you MUST follow the instructions to run the ‘Command Line’ shell command “Shell Command: Install ‘code’ command in PATH” which are detailed in the above link. The Windows installer will do this step automatically.
Installing the Duktape Debugger tool
Duktape Debugger is an extension to VS Code which will allow you to the breakpoint, interrogate variables and step through code that you create in Umajin Editor.
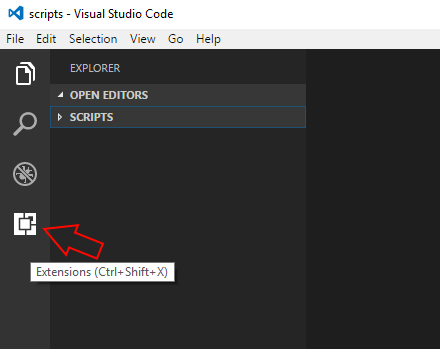
After installing VS Code, you should run it and click the ‘Extensions’ icon on the left-hand hand side of the interface.
Now type “Duktape” into the search box (1) and click install on the green install button (2) under the “Duktape Debugger” extension.
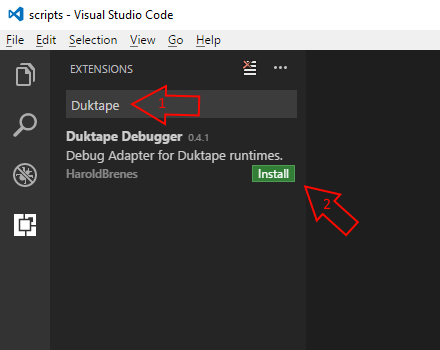
This will install the debugger for the custom JavaScript that you can write in Umajin Editor to add custom components, actions and feeds to your application.
Running VS Code from Umajin Editor
Now that you have VS Code and the Duktape Debugger installed close VS Code for now. You should now run the Umajin Editor and load up your project from within the Editing environment. After your project loads, run VS Code from within the Editor. The VS Code environment can be opened using the Main Menu Item, “Open with Visual Studio Code”.
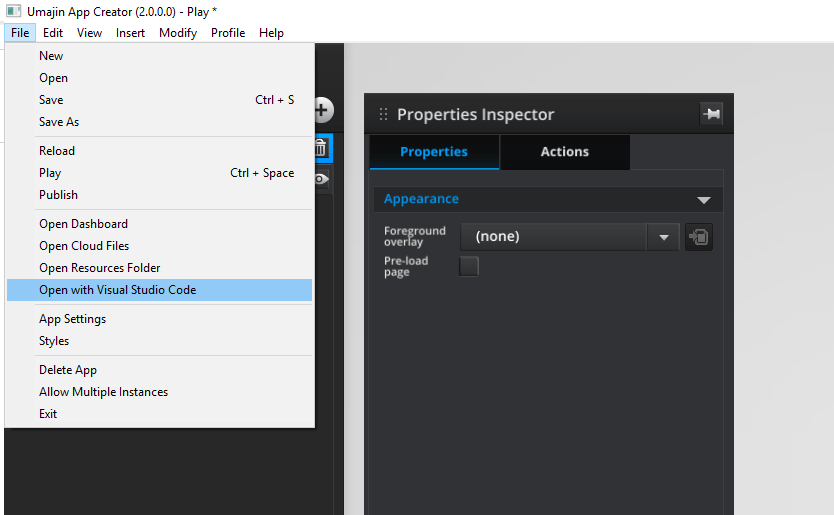
This runs the VS Code environment and sets up the configuration so that you can debug the custom JavaScript code you create.
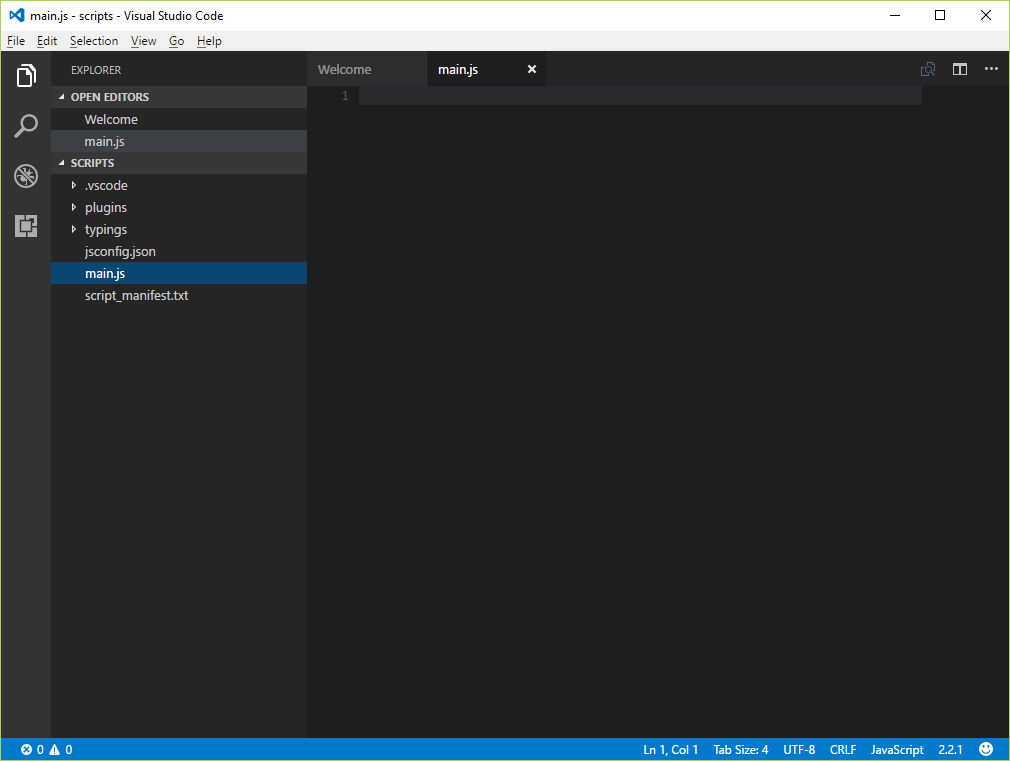
When VS Code opens, it will be pointing at your project script files with a new ‘main.js’ file for you to start coding with as well as configuration files and manifests. These configuration and manifest files can be ignored for the moment.
Now you can go to https://developer.umajin.com for information about how to develop new components, actions and feeds with Umajin Editor.
